Thinking small to ensure global food security
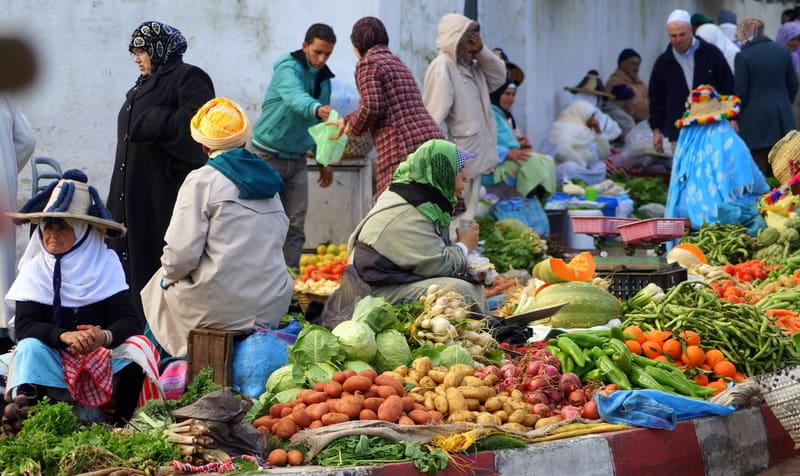
© Gepapix | Dreamstime
Evidence is mounting that smallholder farms, in other words, agricultural fields of less than around two hectares (ha) in size, make a substantial contribution to world food production. In addition, field size is known to be a good indicator of agricultural intensity, which could provide policymakers with valuable information around food security issues. Previous estimates of the total land area used for agriculture have suggested that smaller plots make up between 12% and 24% of the global total. A study led by IIASA researchers, however, puts the total land area of smallholder farms at 40% and has helped to fill some of the gaps in available information on global agricultural field size distribution.
The crowdsourcing campaign that provided the data for the study ran for four weeks starting in June 2017. Data was collected using the Geo-Wiki app, which takes high-resolution satellite imagery from Google Maps and Microsoft Bing and allows users to visually assess those images. In this case, users were asked to assess images of agricultural land.
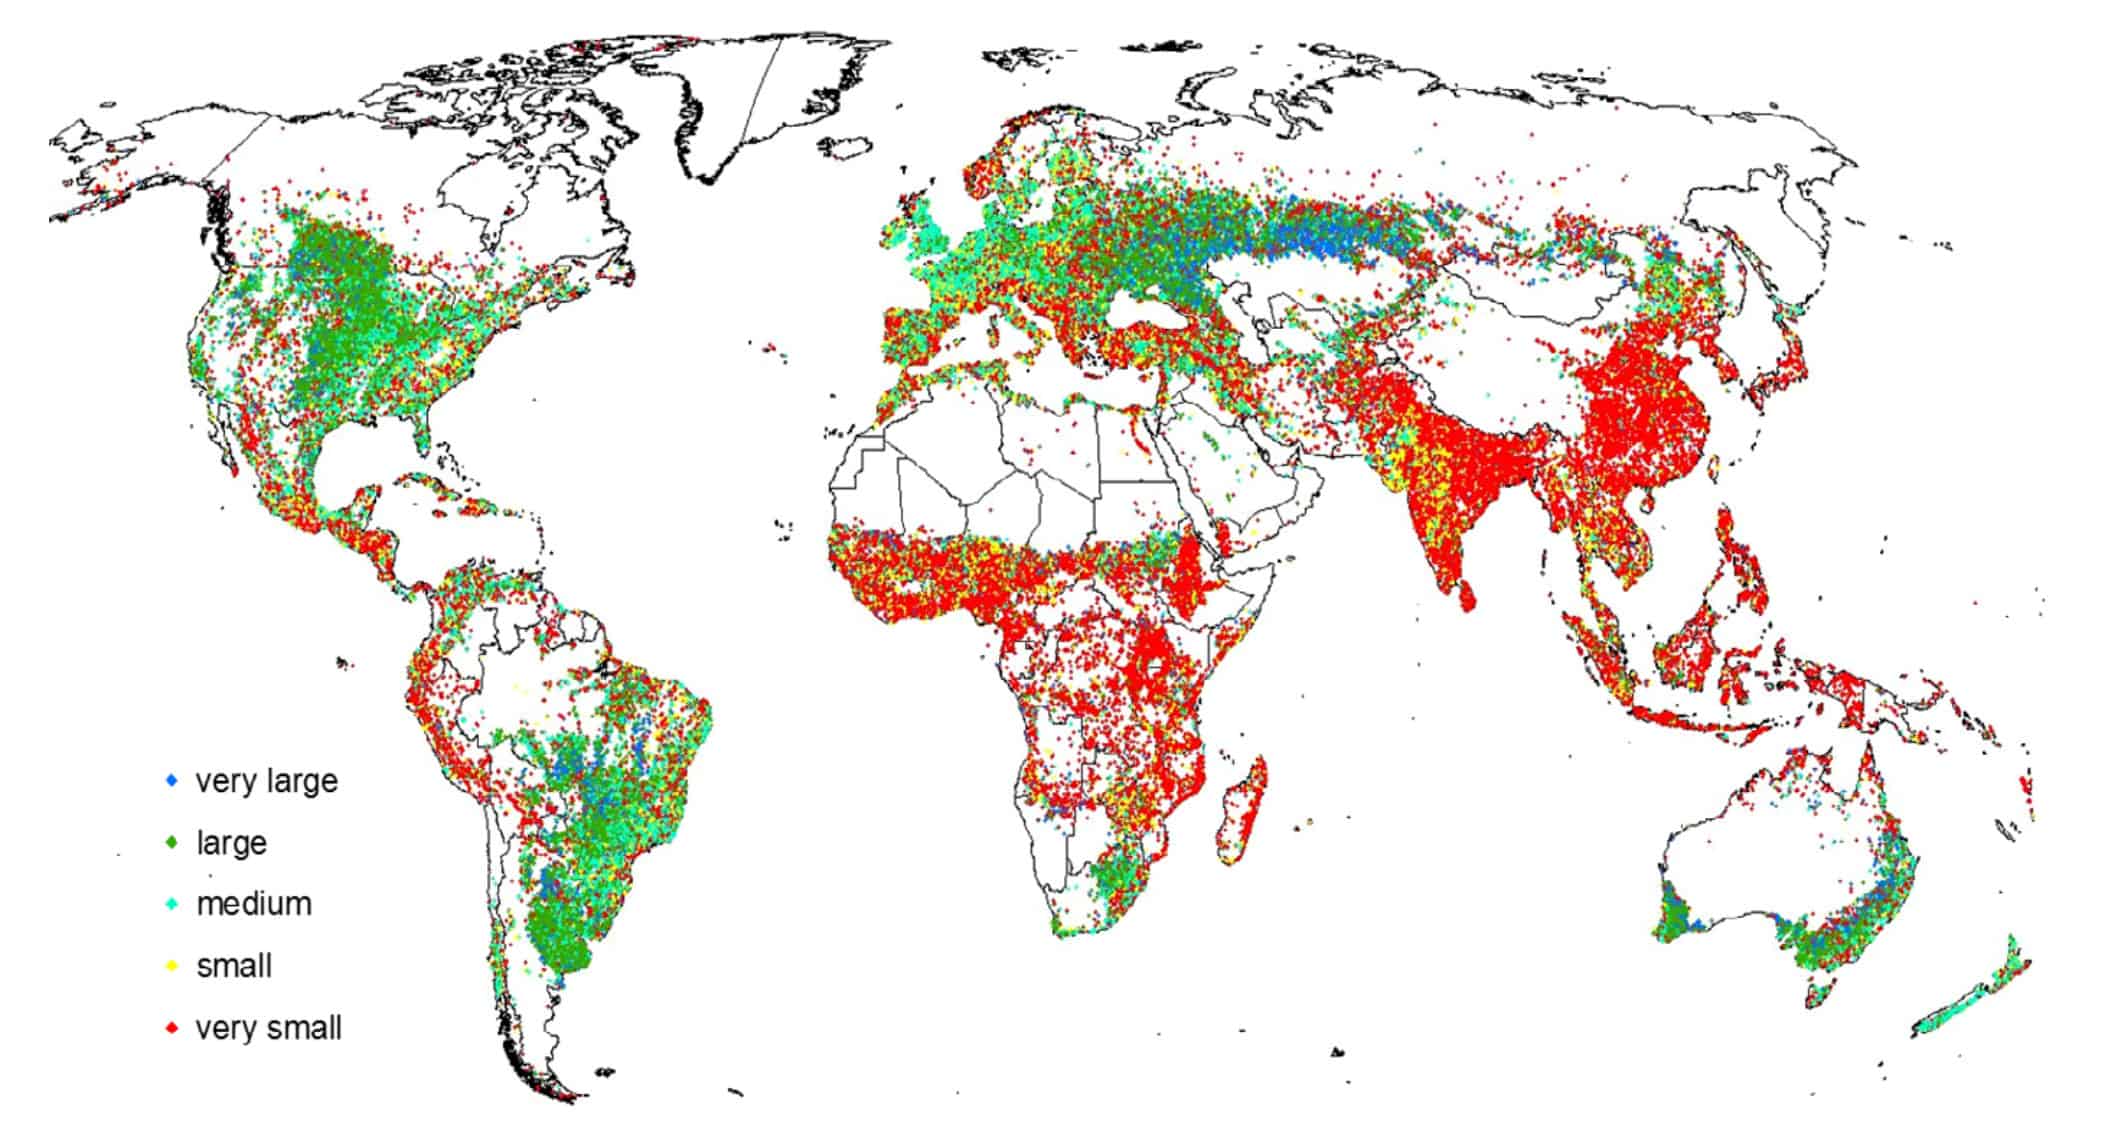
Figure 1: Global distribution of field sizes. [1]
A field was defined as any enclosed agricultural area, including arable and pastureland that could be separated by roads, permanent paths, or vegetation. Users could choose one of five field size categories – very large (greater than 100 ha), large (16-100 ha), medium (2.56-16 ha), small (0.64-2.56 ha), and very small (less than 0.64 ha). An instructional video and slides were used to train participants on how to use the app. Before being allowed to contribute to the official survey, users were asked to complete ten training images, with feedback given on each. Random ‘control’ images that had been expertly assessed were also randomly shown to users, and if these were incorrectly classified, the user received text feedback. This quality control feature was introduced to improve the quality of the results. Prizes were offered as an incentive to participate.
Each image was assessed by three users. A total of 130,000 unique samples were collected over the course of the four weeks, and the researchers used the 390,000 classifications (from three ‘visits’ to each site) to create a map and calculate the agricultural area proportions at the global, continental, and national levels. The study is the first to estimate field sizes at all three levels, and on a global scale. The resulting data set is much more detailed and denser than anything previously collected and is openly available for use in future research.
According to the researchers, this information will give policymakers an accurate overview of the global distribution of field sizes, thus providing better background knowledge for decision making related to food systems and agriculture, and ultimately supporting better policy decisions related to food security issues.
References
[1] Lesiv M, Laso Bayas JC, See L, Duerauer M, Domian D, Durando N, Hazarika R, Kumar Sahariah P et al. (2018). Estimating the Global Distribution of Field Size using Crowdsourcing. Global Change Biology 25 (1): 174-186